By the Numbers
November 25, 2019
2018-19 Enrollment Facts
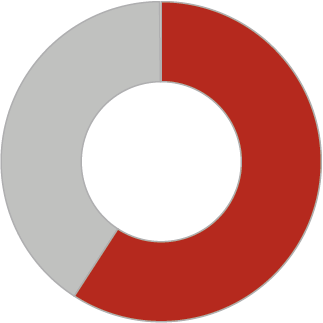
Gender
Female 59%
Male 41%
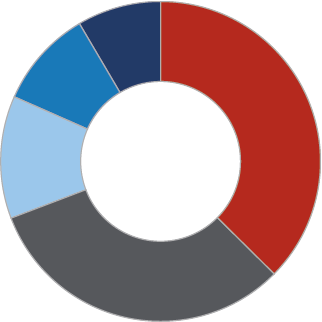
Age
19-24 37%
< 18 32%
25-30 13%
31-40 10%
41+ 8%
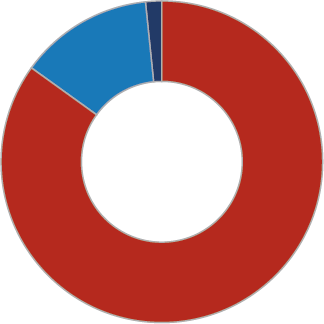
Residency
In-District 85%
Out-of-District 13%
International 2%
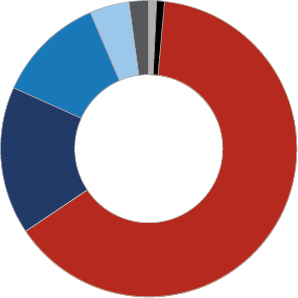
Ethnicity
White 68%
Black or African-American 15%
Hispanic or Latino 11%
Multi-Ethnic 4%
Asian 2%
Indian or Alaskan National .4%
Native Hawaiian or Pacific Islander .1%
3,964
TOTAL STUDENTS
36%
TRANSFERRED
TO A UNIVERSITY
TO A UNIVERSITY
$287,089
SCHOLARSHIPS
PROVIDED BY THE LMC FOUNDATION
PROVIDED BY THE LMC FOUNDATION
10
MOST POPULAR PROGRAMS
- Nursing
- Business
- Arts Transfer
- General Studies
- Skilled Trades Technology
- Diagnostic Medical Sonography
- Sciences Transfer
- Radiological Technology
- Psychology
- Engineering
Annual Tuition Cost Comparison
| Lake Michigan College |
| Southwestern Michigan College |
| University of Phoenix Online |
| Grand Valley State |
| Western Michigan University |
| Michigan State University |
| Indiana University-South Bend |
Annual 2019-20 undergraduate tuition & fees for Michigan residents. Sources: The College Board, College Tuition Compare

Pie chart graphic.

 Ed Bueche (Student) Taylor Jackson (Student) Jasmine Hein (Instructor), Maxwell Eichberg (Instructor), Tim Godfrey (Instructor). Back Row L to R: Sarah Eberly (Student), Jim Walsh (Student), Mark Vrla (Student), Demetrius Karos (Student).")
